Everyday Data: An Interactive Data Installation in CU-Boulder's ATLAS Lobby Space
In the Autumn of 2014, with the hard work of the students in our HCC: Big Data class, I mentored them in creating lobby art installation that combined both the technical and aesthetic aspects of large-scale data collection. The installation was the culminating project of our upper-division class on the subject, and its implementation was supported generously by a grant from CU-Boulder’s Engineering Excellence Fund along with my advisor Tom Yeh.
My initial goal was to create a way to arrange the diverse skills in coding, music, visual art, and circuitry found across the class into a unifying project that would reach out beyond the confines of our classroom. Beyond this, we hoped to turn a passive lobby space into an active interaction that would engage passerbyers, perhaps even away from their often attention-consuming technological devices.
After allowing the class to vote on whether they wanted to take on the project and then what pieces they hoped to implement, we ended up splitting into four teams. Each team’s piece involved a hardware component and a visual component. The hardware was mounted around the lobby to track and offer interactive material while all visualizations were on a rotating display broadcasted on the lobby’s giant 8ft x 6ft digital display. Though hardware varied, all visual components were done using JavaScript’s D3 package.
Descriptions of the four projects are as follows:
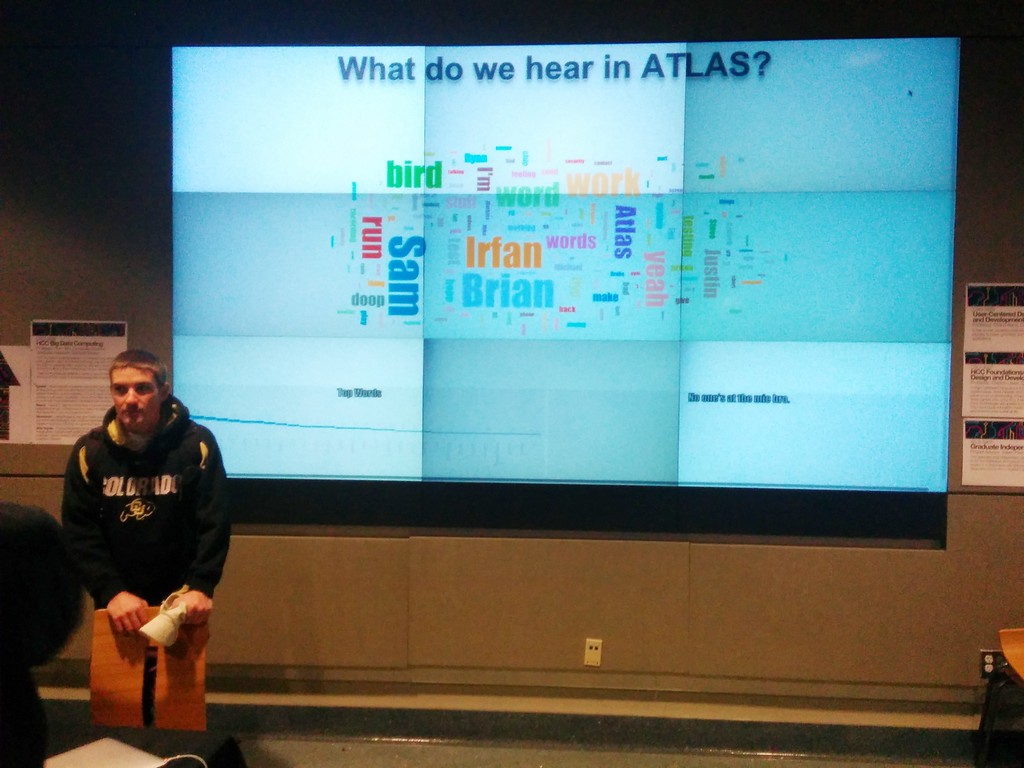 Conversations in ATLAS Lobby: This team mounted two condenser microphones near the study tables in the lobby space and used them to record snippets of conversations in process. The two microphones were connected to a hidden Raspberry Pi computer that converted the recordings into short .wav files that would be processed for semantic information and, words that were confidently inferred, stemmed to their root form. Once the words were processed, they were saved into a MongoDB instance we had waiting in the cloud. Finally words were tallied for their frequency and turned into a giant word cloud accompanied by a bar graph of the most frequent words and word stack showing what was currently being said near the microphones.
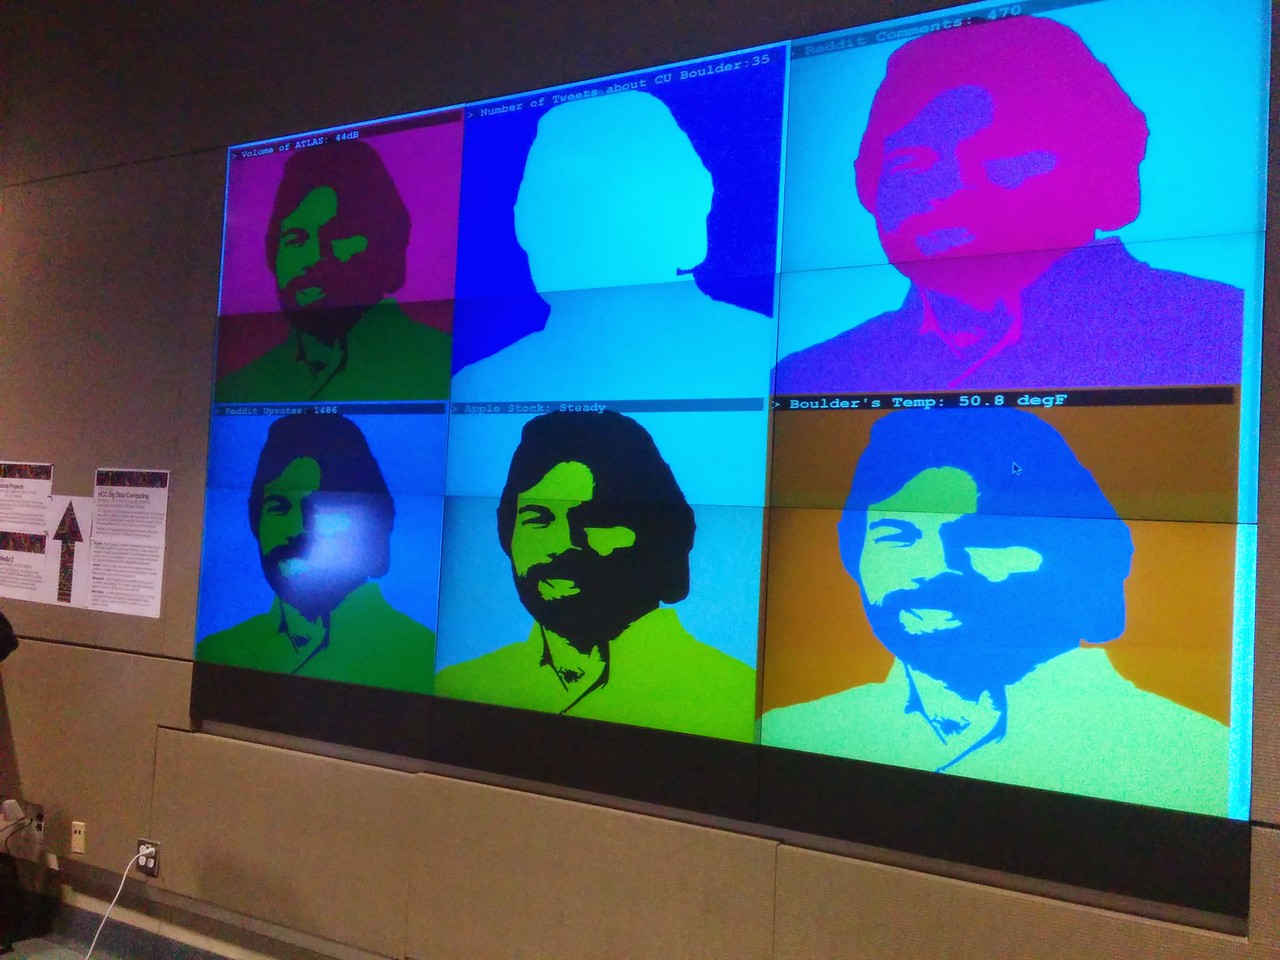 The Four V’s of Woz: An adaptation of Andy Warhol’s iconic repetitious block portraits, these students chose to replace Warhol’s Marilyn Monroe or Jackie Kennedy with a tech icon - Apple co-founder Steve Wozniak. In line with the pop-art imagery, each portrait of Steve Wozniak was filled with bright colors and a high-contrast backdrop. Six images were displayed in succession, each one changing it’s color, brightness, contrast, and saturation parameters based on live data being collected from both the lobby space and around the internet (specifically, data related to CU-Boulder or Apple). For more information, look to the group’s written explanation of their work.
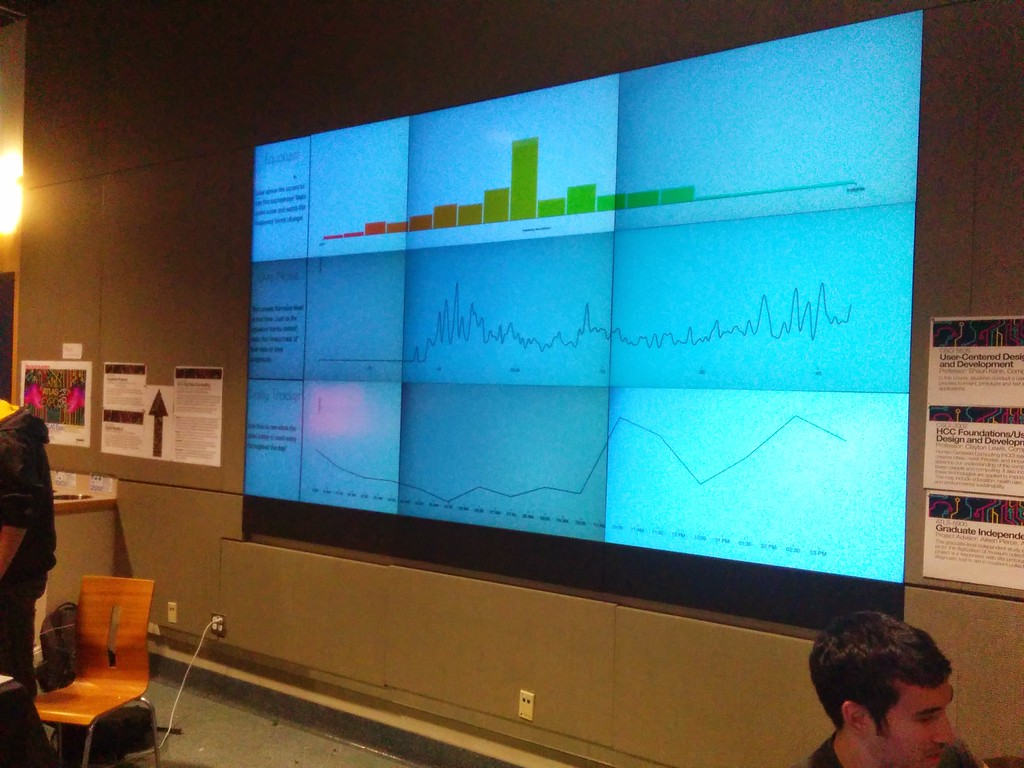 Seeing Your Sound: Featuring a live equalizer, real-time graphing of decibel levels, and a daily average of the loudest and quietest times, this team’s work was a collection of visualizations compiled out of live data being collected from an ambient microphone hanging in above the heads of those in the lobby. The microphone was connected to a Raspberry Pi mounted high above in the rafters. From their the sound data was processed and converted both into a frequency spectrum of the sound samples and an average decibel reading over the sample period. This data was pushed to a cloud-based MongoDB instance through over REST API then digested by JavaScript on the client side to create a live, visual feed of noise events happening in the lobby. All visualizations ran in real-time and had immediate interactivity through a simple shout or loud noise.
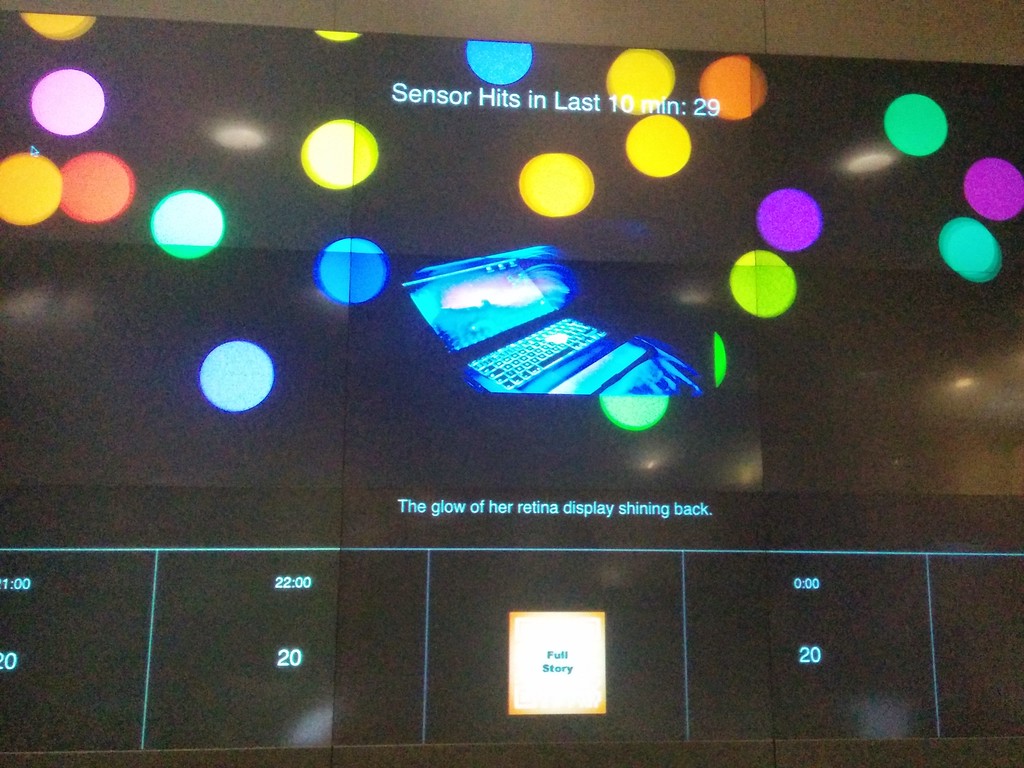 The Bitwise Soul of the 21st Century: Currently this project uses force sensors taped under the floor mats placed at all the entrances/exits to the lobby to track the foot traffic moving through the lobby space. As people walked through the lobby, the patter of their steps fed input into a multi-modal experience. Starting with the force sensors feeding into an arduino, triggers were sent to a Raspberry Pi when any of the entrance/exit sensors were triggered. Upon being triggered, a Japanese string instrument could be heard across the lobby space. Along with this audio experience, a visualization displayed two coordinated facets of the project: particles entered and bounced around in a box as the sensors were stepped on more and a story was being revealed, one sentence at a time, that adapted to the number of people interacting with the sensors. For a further write up of this project, read the [student write up]() of their project and full body of the story. (This project is currently being updated to use Xbox Kinects for body sensing - this description will be updated when this is complete.)
This installation opened on December 11, 2014 at the ATLAS Expo and will remain on display through the Spring of 2015.
If you have any questions or would like to see code or learn more, feel free to contact me at: michael [dot] skirpan [at] colorado [dot] edu
Written on: Wed Dec 17, 2014